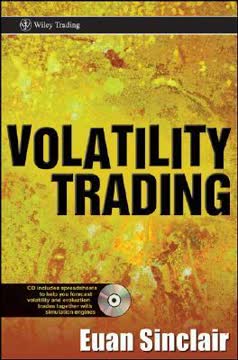
Key Takeaways
1. Volatility is the Core of Option Trading, Not Just Direction
This book is about trading volatility. More specifically, it is about using options to make trades that are primarily dependent on the range of the underlying instrument rather than its direction.
Focus on range. Unlike stocks or futures, options derive their value primarily from the expected magnitude of price movements, not just their direction. A trader's success in options hinges on accurately forecasting this "range" or volatility, rather than predicting if the underlying asset will go up or down. This fundamental distinction means option trading requires a different mindset and analytical toolkit.
Hedging directional risk. The beauty of options is that their directional risk can be largely neutralized through hedging with the underlying asset. This allows traders to isolate their exposure to volatility. By combining options with shares of the underlying, a trader can construct a portfolio whose profit or loss is predominantly determined by whether the actual volatility (realized volatility) is higher or lower than the market's expectation (implied volatility).
Volatility as a tradable asset. In essence, options transform volatility into a tradable asset. This enables strategies that profit from mispricings in volatility itself, rather than relying on directional bets. Understanding this core principle is the first step to becoming a successful volatility trader.
2. The Black-Scholes-Merton Model: A Framework, Not Perfect Reality
The BSM model isn’t good because it is an accurate representation of reality. It is actually fairly poor in this regard, with most of the model’s assumptions being gross oversimplifications. It is a good model because the weaknesses are well understood and the model gives results that are intuitively sensible.
A conceptual language. The Black-Scholes-Merton (BSM) model is the foundational framework for option pricing, serving as the "language" for derivatives traders. It's not a perfect mirror of the real world, but its utility lies in providing a consistent way to translate complex option prices into a single, more manageable parameter: implied volatility. This allows for comparison across different options, strikes, and maturities.
Key simplifying assumptions: The BSM model relies on several unrealistic assumptions, which are crucial to understand for effective trading:
- No transaction costs
- Continuous trading and hedging
- Constant interest rates and volatility
- Log-normally distributed underlying returns (no fat tails or skew)
- No dividends or storage costs
Trading its inadequacies. The power of BSM for traders comes from understanding where its assumptions break down. These breakdowns create opportunities. For instance, the model's assumption of constant volatility leads to the "volatility smile" in real markets, where options with different strikes have different implied volatilities. Profiting from these "inadequacies" is a central theme in volatility trading.
3. Volatility Exhibits Predictable "Stylized Facts"
Large changes tend to be followed by large changes . . . and small changes tend to be followed by small changes.
Volatility clustering. Financial market volatility is not constant; it tends to cluster. Periods of high volatility are often followed by more high volatility, and calm periods by more calm. This "long memory" effect makes volatility somewhat predictable, unlike asset returns which are largely unpredictable.
Mean reversion and fat tails. While volatility clusters, it also exhibits mean reversion, meaning it tends to revert to a long-term average over time. However, this long-term mean itself can shift. Other key stylized facts include:
- Fat tails: Large price movements occur far more frequently than a normal distribution would predict.
- Negative skew: Downside moves are typically larger and more frequent than upside moves.
- Leverage effect: Volatility tends to increase when underlying prices decline.
- Volume correlation: Trading volume and volatility are strongly positively correlated.
Implications for forecasting. These stylized facts are crucial for building effective volatility forecasting models. Simple models like moving averages or exponentially weighted moving averages (EWMA) capture some clustering, but more sophisticated models like GARCH (Generalized Auto-Regressive Conditional Heteroskedasticity) explicitly account for mean reversion and the persistence of volatility shocks.
4. Forecast Volatility as a Distribution, Not Just a Point Estimate
A point forecast of volatility just isn’t all that useful. We need a forecast of the volatility distribution.
Beyond a single number. While models like GARCH can provide a point estimate of future volatility, successful option trading demands more. Traders need to understand the range of possible future volatilities to make informed risk/reward decisions. Knowing that volatility is expected to be 20% is less useful than knowing it typically ranges between 15% and 35%.
Volatility cones. A practical tool for visualizing this distribution is the "volatility cone." This plots the historical maximum, minimum, and percentile ranges of realized volatility for different time horizons (e.g., 30-day, 60-day, 90-day).
- Visual context: Cones show how short-term volatilities fluctuate more widely than longer-term ones.
- Historical perspective: They place current implied volatility into a historical context, revealing if it's unusually high or low for a given maturity.
- Decision support: Selling implied volatility at 35% might seem attractive if the forecast is 20%, but a volatility cone showing a historical range of 11-35% provides a much richer understanding of the potential outcomes.
Integrating fundamental insights. Beyond statistical models, fundamental information about the underlying asset (e.g., earnings announcements, R&D costs, leverage) can also inform volatility forecasts, especially for longer-dated options. This multi-faceted approach helps build a more robust understanding of future volatility.
5. Hedging is Essential for Volatility Trading, But It's Costly
Replication risks due to imperfect hedging can easily exceed the anticipated profits from the perceived implied volatility mispricing.
Isolating volatility exposure. Hedging is fundamental to volatility trading; it removes unwanted directional risk from an option position, allowing the trader to profit solely from their view on volatility. Without effective hedging, an option trade becomes a directional bet, which is not the goal of volatility trading.
The cost of continuous hedging. While the Black-Scholes model assumes continuous, costless hedging, real-world trading involves significant transaction costs (commissions, bid/ask spreads, market impact). Continuously rebalancing a delta-hedged position would incur infinite costs, eroding any potential profit. This creates a trade-off: hedge more frequently to reduce risk, or less frequently to reduce costs.
Optimal hedging strategies. Ad hoc methods (e.g., hedging at fixed time intervals or delta bands) are common but suboptimal. Utility-based models, like Hodges-Neuberger or Zakamouline's approximation, offer a more rigorous approach by balancing risk aversion with transaction costs. These models suggest:
- Asymmetric bands: Long and short option positions should be hedged differently.
- Modified delta: The optimal hedging point may not be the BSM delta.
- Market impact: Transaction costs scale with trade size and market liquidity.
Beyond dynamic hedging. Dynamic hedging with the underlying asset cannot fully mitigate risks from large, sudden price jumps. Static hedging, using other options, is often necessary to protect against these unhedgeable tail risks.
6. Trade Sizing is Paramount for Long-Term Survival and Growth
Everybody’s got a plan until they get hit.
Beyond edge, sizing matters. Even the best trading strategy with a proven edge can be ruined by poor money management. Trade sizing determines how much capital is allocated to each opportunity, directly impacting overall profitability, volatility of returns, and drawdown risk.
The Kelly Criterion. The Kelly Criterion offers a mathematically optimal approach to maximizing long-term wealth growth by determining the ideal fraction of one's bankroll to bet on each trade.
- Binary outcomes: For simple bets,
f = (pw - ql) / (wl), wherepis win probability,qis loss probability,wis win payout, andlis loss payout. - Continuous outcomes: For financial trades,
f ≈ r / σ^2, whereris expected return andσ^2is variance. - Risk of ruin: Kelly betting has zero theoretical risk of ruin, but it is highly volatile.
Managing volatility and drawdowns. Full Kelly betting often leads to uncomfortably large swings in equity. Many traders opt for "fractional Kelly" (e.g., half-Kelly) to reduce volatility and drawdowns, sacrificing some long-term growth for smoother short-term performance. This also acts as a pragmatic acknowledgment of parameter uncertainty.
Mean-reverting assets. For mean-reverting strategies (like selling volatility when it's high), optimal sizing may involve increasing position size as the trade initially moves against you, up to a certain point. This counter-intuitive approach is based on the increasing edge as the asset deviates further from its mean, but requires careful risk management against regime shifts.
7. Behavioral Biases Drive Market Inefficiencies and Trading Opportunities
No problem in judgment and decision making is more prevalent and more potentially catastrophic than overconfidence.
Exploiting human irrationality. While markets are generally efficient, psychological biases create systematic errors in judgment that can lead to mispricings. Recognizing these biases in others allows traders to identify and exploit profitable opportunities.
Key biases and their trading implications:
- Overconfidence: Leads to overtrading, poor diversification, and underestimation of extreme risks. Traders may believe they "see it coming" when volatility spikes.
- Loss Aversion: People dislike losses more than they like gains, leading to "get-even-itis" (holding losing positions too long) and a preference for options with limited downside, driving up their prices (variance premium).
- Availability Heuristic: Decisions are based on easily recalled, often dramatic, events, leading to misjudgment of probabilities (e.g., overestimating crash likelihood).
- Confirmation Bias: Seeking out and overemphasizing evidence that supports existing beliefs, while downplaying contradictory evidence, leading to rigid views.
- Hindsight Bias: Believing past events were predictable, leading to overestimation of one's forecasting ability and taking excessive risk.
- Anchoring and Adjustment: Basing estimates on initial "anchors" (e.g., 52-week highs/lows) and making insufficient adjustments, creating predictable price reactions.
Mitigating personal biases. Awareness of these biases is the first step to mitigating their impact on one's own trading. Strategies include:
- Objective analysis: Rely on rigorous statistical analysis and pre-defined rules.
- Post-trade review: Objectively analyze all trades, not just big wins/losses.
- Partnering: A trusted trading partner can provide an unbiased perspective.
- Process over emotion: Stick to a disciplined process to avoid impulsive decisions.
8. The Variance Premium Offers a Consistent Edge in Index Options
Implied volatility of broad indices is generally too high. This doesn’t necessarily mean we always want to be short index options, but it is a real effect we need to be aware of.
A persistent market anomaly. A significant "beta" source of return in volatility trading is the variance premium, particularly prevalent in broad equity indices (like the S&P 500 or NASDAQ-100). Implied volatility, derived from index options, consistently trades higher than the subsequent realized volatility.
Profitability of selling index volatility. Studies and historical simulations show that strategies involving selling straddles or strangles on equity indices, while delta-hedged, have historically generated positive returns with reasonable Sharpe ratios. This is essentially selling insurance against large market moves.
- Index vs. single stock: This premium is much stronger and more consistent for indices than for individual equities.
- Market conditions: The strategy performs best when overall volatility is low or declining, and suffers during periods of high market turmoil (e.g., 2008 financial crisis).
Underlying reasons for the premium: Several factors contribute to this persistent premium:
- Insurance demand: Investors pay a premium for downside protection (puts).
- Skewness premium: Indices often have a steeper implied volatility skew, reflecting higher demand for out-of-the-money puts.
- Correlation premium: Index volatility implicitly includes a correlation component, and correlations tend to spike during market downturns, making index options more expensive.
- Behavioral biases: Loss aversion and overestimation of crash probabilities by option buyers.
Managing the risk. While profitable, selling index volatility carries significant tail risk (large losses during market crashes). Strategies often involve filtering trades based on VIX levels or trends to avoid periods of extreme risk.
9. Leveraged ETFs are Perpetual Volatility Products, Not Designed to Decay
The goes to zero myth arises from a misunderstanding of the implications of volatility drag.
The "decay to zero" myth debunked. A common misconception is that leveraged ETFs are "designed to go to zero" due to daily rebalancing and volatility drag. This is false. While volatility drag (the effect of compounding returns in a volatile environment) does exist and is exacerbated by leverage, it doesn't guarantee decay to zero.
Volatility drag explained. Leveraged ETFs aim to deliver a multiple (λ) of the daily return of an underlying asset. Over longer periods, the cumulative return of the ETF is affected by the underlying's volatility. The ETF's value can be approximated as L = L0 * (S/S0)^λ * exp(-0.5 * λ * (λ-1) * σ^2 * t).
- Two components: This formula shows a leveraged return component and a volatility drag component.
- Overperformance possible: If the underlying asset trends strongly, the leveraged return can easily overcome the volatility drag, leading to significant outperformance (e.g., UBT outperforming TLT).
Trading implications. Leveraged ETFs are essentially perpetual realized volatility products. Understanding their mechanics opens up several volatility-dependent trading strategies:
- Long-short strategies: Combining a leveraged ETF with a position in its underlying can create a portfolio sensitive only to realized volatility.
- Options on leveraged ETFs: These can be priced as compound options, allowing for comparison of implied volatilities between the leveraged ETF and its reference product.
Trade sizing perspective. From a Kelly Criterion perspective, leveraged ETFs represent a fixed, often aggressive, leverage bet on the underlying. If the underlying's expected return and volatility make the Kelly fraction for a leverage of 1.0 small, then a leverage of 2.0 or 3.0 could easily push the growth rate into negative territory.
10. A Consistent Trading Process, Backed by Data, is the Ultimate Edge
Your goal must be clearly defined and easily expressed. It must be one thing.
Process over outcome. Successful trading isn't about predicting every market move or having perfect foresight; it's about developing and adhering to a consistent, disciplined process. This process encompasses goal setting, trade identification, execution, risk management, and continuous evaluation.
Key elements of a robust trading process:
- Clear goals: Define specific, measurable, achievable, relevant, and time-bound objectives (e.g., "achieve X% return with Y% max drawdown").
- Edge identification: Know exactly what your statistical edge is for every trade. If you don't, don't trade.
- Execution and hedging: Implement trades efficiently and manage risk through a well-defined hedging strategy, understanding its costs and limitations.
- Money management: Size trades according to a pre-established plan (e.g., fractional Kelly) that aligns with your risk tolerance and goals.
- Detailed record-keeping: Track every aspect of your trades (P/L, drawdowns, win/loss ratios, costs) to objectively evaluate performance and identify areas for improvement.
Continuous learning and adaptation. Markets, products, and technology constantly evolve. A successful trader must continuously learn, adapt, and refine their process. This involves:
- Post-trade analysis: Objectively review results against pre-defined benchmarks.
- Self-reflection: Identify personal biases and areas for skill development.
- Market awareness: Stay informed about structural changes and new opportunities.
Beyond technical skill. While technical knowledge is crucial, other factors like execution ability, concentration, product selection, and even a positive attitude contribute significantly to long-term success. The best traders combine rigorous analysis with disciplined execution and a relentless focus on continuous improvement.
Last updated:
Review Summary
Volatility Trading, + website receives mostly positive reviews, with readers praising its comprehensive approach to volatility trading and options. Many appreciate Sinclair's practical insights and mathematical rigor. However, some find the book overly technical and challenging for non-experts. Readers value the author's trading experience and clear explanations. The book is recommended for those with a strong mathematical background and serious interest in volatility trading. Some note typos and suggest it may be too advanced for beginners or casual investors.
Similar Books






Download PDF
Download EPUB
.epub digital book format is ideal for reading ebooks on phones, tablets, and e-readers.
