Key Takeaways
1. Economic Indicators: The Market's Hidden Drivers
The daily flow of high-frequency economic indicators is the stuff that makes financial markets move and that can signal the big trends that make or break investor portfolios.
Market Movers. Economic indicators, though seemingly abstract, are the vital barometers that reveal the economy's current state and future direction. Their release can trigger frenzied activity in global stock, bond, and currency markets, directly impacting investor portfolios and financial well-being. This intense market reaction is why sensitive reports are guarded with prison-like secrecy in "lock-up" rooms, preventing insider trading.
Ripple Effects. Beyond financial markets, these indicators have profound real-world consequences for everyone. A strong jobs report, for instance, can lead to higher interest rates on mortgages and car loans, while also boosting commodity prices like oil. Conversely, a weak report might signal lower rates but also job insecurity.
- Benefits: Rising employment, increased consumer spending, eased federal budget strain.
- Drawbacks: Higher borrowing costs, increased fuel prices, potential trade imbalances.
Accuracy and Timeliness. Not all indicators are created equal; their influence depends on accuracy, timeliness, and predictive ability. Investors prioritize reports that are released quickly and are known for reliability, such as the employment situation report, which comes out barely a week after the month ends. Indicators with a history of large revisions, like construction spending, tend to be less impactful.
2. Mastering the Language of Economic Data
The language of economic indicators is fairly straightforward if you give it a chance.
Decoding Jargon. Understanding economic indicators requires familiarity with a few core terms that clarify their meaning and significance. These concepts help interpret the data accurately, distinguishing genuine trends from statistical noise. Key terms include:
- Annual Rates: Projecting a monthly or quarterly pace over a full year (e.g., 14 million vehicle annual rate).
- Business Cycle: The natural ebb and flow of economic activity, encompassing growth, recession, trough, recovery, and expansion.
- Nominal vs. Real Dollars: Nominal (current) dollars reflect actual amounts, while real (constant) dollars adjust for inflation, showing true purchasing power or volume.
Statistical Nuances. Economic data is rarely perfect; it's often preliminary and subject to change. Revisions are common as more complete information becomes available, while benchmark changes occur periodically to update methodologies or seasonal adjustments.
- Revisions: Ongoing efforts to improve accuracy, especially for initial preliminary figures.
- Benchmarks: Infrequent, formal changes to methodology or seasonal factors, potentially affecting historical data.
Smoothing Volatility. Economic numbers can be erratic due to unusual events like strikes or severe weather. To discern true underlying trends, analysts often rely on "moving averages," which smooth out short-term fluctuations by averaging data over a fixed number of recent months. This provides a clearer, albeit lagging, picture of economic direction.
3. Employment Reports: The Economy's Most Potent Signal
No single economic indicator can jolt the stock and bond markets as much as the jobs report.
The Jobs Report's Power. The monthly Employment Situation report is the most eagerly awaited economic news, capable of profoundly impacting financial markets. Its timeliness (released just a week after month-end) and rich detail on job creation, wages, and hours worked make it an indispensable forecast tool for future economic activity. The report combines two surveys:
- Household Survey: Determines the unemployment rate by polling 60,000 homes, including farm workers and the self-employed.
- Establishment (Payroll) Survey: Considered more reliable, it directly queries 400,000 businesses and government agencies on non-farm payrolls, average workweek, and hourly earnings.
Conflicting Signals. While both surveys aim to capture labor market conditions, they can occasionally diverge due to differing methodologies and inclusions (e.g., self-employed counted in household but not establishment). However, over the long run, their trends align. The establishment survey's non-farm payrolls are particularly scrutinized, as they offer the strongest evidence of job creation or loss in the private sector.
Leading Indicators within Jobs Data. Beyond the headline unemployment rate, specific components offer forward-looking clues:
- Average Hours Worked: A sustained increase often precedes accelerated hiring.
- Overtime Hours: Rising overtime can signal upcoming permanent hires, as it's costly and unsustainable long-term.
- ADP National Employment Report: A newer, highly anticipated private report based on actual payroll data from over 350,000 firms, offering a timely preview of the government's official numbers.
4. Consumer Spending: The Unquestioned Engine of Growth
Consumers rule the economy, plain and simple.
Driving Force. Consumer expenditures are the primary engine of the U.S. economy, accounting for over two-thirds of its total output. Their spending habits directly influence sales, factory output, business investments, and job growth. The "Personal Income and Spending" report is crucial, detailing how much Americans earn, spend, and save.
- Personal Income: Money households receive before taxes, crucial for spending capacity.
- Disposable Personal Income (DPI): Income left after taxes, representing true spendable money.
- Personal Consumption Expenditures (PCE): The most comprehensive measure of consumer spending, covering durable goods (cars, appliances), nondurable goods (food, clothing), and services (medical care, haircuts).
Spending Insights. While the "Retail Sales" report offers a timely, albeit narrower, view of consumer goods purchases, the PCE is broader and a key component of GDP. Durable goods spending is particularly sensitive to economic shifts, acting as a leading indicator. Consumer confidence surveys, though intuitive, often show a weak correlation with actual spending, suggesting that actions (cash register activity) speak louder than words.
Savings and Debt. The "Personal Savings Rate" reveals how much income is saved after spending. A low or negative savings rate, coupled with rising "Consumer Credit Outstanding," can signal household financial stress, potentially leading to future spending retrenchment. Monitoring interest payments as a proportion of disposable income can also flag potential trouble for future consumer demand.
5. Manufacturing Surveys: Early Warnings from the Factory Floor
By virtue of their position, purchasing managers are in the forefront of monitoring activity in manufacturing.
The ISM's Influence. The Institute for Supply Management (ISM) Manufacturing Survey is the first and most influential private-sector report on the economy each month. Purchasing managers, responsible for procuring materials, offer a unique, forward-looking perspective on factory activity. Their insights into new orders, production, employment, and supplier deliveries provide early clues about the broader economy.
- Purchasing Managers Index (PMI): A diffusion index where a reading above 50 indicates manufacturing expansion, below 50 contraction.
- Timeliness: Released on the first business day of the month, making it highly impactful.
Key Components. Beyond the headline PMI, several sub-indices offer critical insights:
- New Orders: A strong leading indicator; a jump signals future production increases.
- Supplier Deliveries: Longer delivery times (higher index) suggest strong demand and potential bottlenecks, hinting at future inflation.
- Prices Paid: Reveals early inflationary pressures on raw materials, which can eventually pass to consumers.
Industrial Production's Role. The Federal Reserve's "Industrial Production and Capacity Utilization" report measures the physical output of U.S. industry (manufacturing, mining, utilities) and the amount of spare capacity. Industrial production is a good coincident indicator, reflecting current economic conditions.
- Capacity Utilization: Measures how much industry is producing relative to its maximum potential. Rates above 80-81% can signal resource shortages and building inflationary pressures, prompting new capital investments.
6. Housing: The Economy's Reliable Bellwether
Excluding one brief instance, there has never been a recession in the U.S. at a time when the housing sector stood strong.
A Leading Indicator. Housing is arguably the most reliable leading indicator of economic activity, often being the first sector to weaken before a recession and the first to rebound during a recovery. Its sensitivity to interest rates is key: rising mortgage rates depress demand and construction, while falling rates rekindle interest.
- Housing Starts: Records new residential groundbreakings, reflecting builder confidence.
- Building Permits: Authorizations for future construction, a component of the Conference Board's Leading Economic Indicators.
Multiplier Effect. The impact of housing extends far beyond construction itself. A vibrant housing market stimulates demand for numerous other industries, including:
- Building materials (steel, wood, glass)
- Skilled labor (carpenters, electricians)
- Home furnishings and appliances
This "multiplier effect" makes housing a major swing industry for the broader economy.
Sales and Affordability. "New Home Sales" are a more timely measure than "Existing Home Sales" (which are counted at closing), as they're recorded when the initial contract is signed. The "Months' Supply" of new homes (inventory-to-sales ratio) indicates market balance, with a supply below four months encouraging new construction. The "Housing Affordability Index" assesses whether a typical family can qualify for a mortgage, influencing future demand.
7. The Federal Reserve: Decoding Monetary Policy Signals
Controlling this mighty tool in the short run is the Federal Reserve Board, or, more precisely, a group within the Fed known as the Federal Open Market Committee (FOMC).
The Fed's Power. The Federal Reserve, through its Federal Open Market Committee (FOMC), wields immense power over the U.S. economy by setting the "federal funds rate"—the interest rate banks charge each other for overnight loans. Changes in this rate ripple through the entire financial system, influencing consumer spending, business investment, and overall economic growth.
- Higher Fed Funds Rate: Makes borrowing more expensive, slowing economic activity to curb inflation.
- Lower Fed Funds Rate: Makes borrowing cheaper, stimulating spending to revive growth.
FOMC Statement's Impact. The FOMC meets eight times a year, and its brief, single-page statement announcing interest rate decisions is meticulously scrutinized by global markets. Every word is parsed for clues about the Fed's economic outlook, inflation concerns, and future policy bias. Dissents among FOMC members are particularly noteworthy, signaling internal disagreements on economic direction.
Regional Insights. While the FOMC statement is paramount, other Fed publications offer valuable context:
- The Beige Book: Released two weeks before each FOMC meeting, this anecdotal summary of economic conditions from the 12 Federal Reserve Districts provides a qualitative backdrop for policy discussions.
- Regional Fed Surveys: Monthly manufacturing surveys from banks like New York (Empire State), Philadelphia, and Kansas City offer timely, localized insights into industrial activity, often foreshadowing national trends.
8. Inflation: The Relentless Threat to Financial Stability
Inflation is public enemy number one to the financial markets.
The Cost of Living. Inflation, the general rise in prices, impacts everyone by eroding purchasing power, increasing business costs, and distorting investments. The "Consumer Price Index (CPI)" is the most popular measure, tracking the average change in retail prices for a basket of goods and services.
- CPI-U: Covers all urban consumers, representing 87% of the population.
- Core-CPI: Excludes volatile food and energy costs, preferred by the Federal Reserve for gauging underlying inflation trends.
Producer Price Pressures. The "Producer Price Index (PPI)" measures price changes paid by manufacturers and wholesalers at various stages of production (crude, intermediate, finished goods). A jump in the PPI, especially for finished goods, can signal future consumer price inflation, as businesses pass on higher costs.
- PPI for Finished Goods: Most closely watched, as these are products ready for retailers.
- Core-PPI: Excludes food and energy, providing a clearer view of industrial price trends.
Labor Costs and Productivity. The "Employment Cost Index (ECI)" is a comprehensive measure of labor costs (wages, salaries, and benefits), which account for over 70% of business expenses. If compensation rises faster than "Productivity" (output per hour), it leads to higher "Unit Labor Costs," a strong harbinger of inflation.
- Productivity Growth: Essential for non-inflationary economic expansion and higher living standards.
- Unit Labor Costs: When these rise, companies face pressure to increase prices or accept lower profits.
9. The Yield Curve: An Uncanny Predictor of Recessions
When it comes to predicting the future course of the economy, only one indicator stands above all others in terms of accuracy: the yield curve.
The Shape of Expectations. The yield curve plots the yields of U.S. Treasury securities across different maturities, from short-term bills to long-term bonds. Its shape reflects the collective wisdom of investors on the likely direction of the economy and inflation.
- Normal Yield Curve: Short-term yields are lower than long-term yields, indicating expectations of economic growth and moderate inflation.
- Steep Yield Curve: Long-term yields rise much faster than short-term, often signaling an accelerating economy and potential inflation concerns.
The Inversion Signal. An "inverted yield curve," where short-term rates are higher than long-term rates, is an almost infallible predictor of an impending recession. Since 1960, every U.S. recession has been preceded by an inverted yield curve months in advance, a consistency unmatched by any other indicator. This inversion suggests that the market expects the Federal Reserve to keep short-term rates high, eventually slowing the economy and leading to lower long-term rates.
A Conundrum? While historically reliable, the yield curve's inversion in 2005-2006 without an immediate recession led some to question its predictive power, dubbing it a "conundrum." This behavior was partly attributed to strong foreign demand for long-term U.S. Treasuries from oil exporters and central banks (like China's) seeking safe, liquid investments and managing their currencies.
- Foreign Demand: Global capital flows can distort the curve, as foreign buyers seek U.S. debt for reasons beyond domestic economic outlook.
- Fed's Success: The Fed's strong anti-inflation stance may have also made long-term bonds more attractive, keeping yields lower.
10. Global Indicators: Navigating an Interconnected World
To be a successful investor or an effective corporate leader in today’s highly integrated global economy also requires knowledge of what is going on beyond U.S. borders.
Beyond U.S. Borders. In an increasingly interconnected global economy, understanding international economic indicators is crucial for investors and business leaders. Nearly half of S&P 500 earnings originate from outside the U.S., and foreign capital flows are vital for financing U.S. growth. Diversifying investments globally can also offer higher returns and mitigate risks tied to a single economy.
Key Global Players. Monitoring major economies like Germany, Japan, and China is essential due to their significant influence on global trade, capital markets, and currency values.
- Germany: Europe's largest economy, its industrial production and IFO Business Survey are key indicators for the Eurozone.
- Japan: The world's second-largest economy and a major holder of U.S. debt, its Tankan survey and industrial production offer insights into its economic health.
- China: A rapidly growing economic superpower, its industrial production and vast foreign exchange reserves impact global trade and capital flows.
Global Surveys and Capital Flows. Standardized surveys like the "Eurozone Manufacturing PMI" and "Global Manufacturing PMI" offer timely, comparable insights into regional and worldwide manufacturing trends, overcoming the lag and inconsistencies of official government data. The "Treasury International Capital (TIC) System" tracks cross-border investment flows, revealing foreign confidence in U.S. assets.
- PMI Surveys: Provide early signals of manufacturing expansion or contraction across multiple countries.
- TIC Data: Shows whether foreign investors are buying or selling U.S. stocks and bonds, crucial for understanding the financing of the U.S. current account deficit.
Last updated:
FAQ
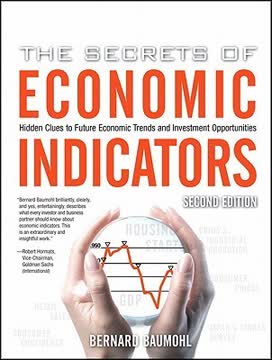
What is "The Secrets of Economic Indicators" by Bernard Baumohl about?
- Comprehensive guide to indicators: The book explains the most influential U.S. and international economic indicators, detailing how they are calculated and their impact on financial markets.
- Practical investment focus: It teaches readers how to interpret economic data to make informed investment and business decisions.
- Global perspective: Baumohl covers both U.S. and key foreign indicators, reflecting the interconnectedness of the global economy.
- Market sensitivity analysis: Each indicator is analyzed for its typical effect on stocks, bonds, and currencies.
Why should I read "The Secrets of Economic Indicators" by Bernard Baumohl?
- Demystifies complex data: The book breaks down complicated economic statistics into clear, actionable insights for investors, business leaders, and policymakers.
- Empowers independent analysis: Readers learn to interpret market-moving reports themselves, gaining an edge over those who rely solely on expert commentary.
- Up-to-date and practical: The latest edition includes new indicators, methodological updates, and online data resources.
- Global relevance: Understanding both U.S. and international indicators prepares readers for a globalized investment environment.
What are the key takeaways from "The Secrets of Economic Indicators" by Bernard Baumohl?
- Indicator interpretation skills: Readers gain the ability to analyze leading, coincident, and lagging indicators to forecast economic trends.
- Market impact awareness: The book connects economic data releases to their effects on stocks, bonds, and currencies, helping readers anticipate market reactions.
- Holistic approach: Baumohl emphasizes using a combination of indicators, both domestic and international, for a well-rounded economic outlook.
- Caution with data: The importance of understanding data revisions, seasonal adjustments, and the limitations of each indicator is highlighted.
What are the most important U.S. economic indicators according to Bernard Baumohl?
- Employment Situation Report: Provides critical data on job creation, wages, and unemployment, directly influencing consumer spending and markets.
- Consumer Spending and Confidence: Includes personal income, retail sales, and consumer confidence indexes, reflecting household demand.
- National Output and Inventories: GDP, durable goods orders, and industrial production signal overall economic activity and business investment.
- Federal Reserve Reports and Trade: Regional Fed surveys and trade data offer insights into economic conditions and international demand.
- Prices, Productivity, and Wages: Inflation measures like CPI and PPI, along with productivity and wage data, affect interest rates and purchasing power.
How does Bernard Baumohl explain the calculation and significance of GDP in "The Secrets of Economic Indicators"?
- GDP compilation process: GDP is calculated by the Bureau of Economic Analysis using thousands of data points from both government and private sources.
- Growth rate interpretation: A real annual growth rate of 3%–3.5% is considered healthy; higher rates may risk inflation, while lower rates can signal rising unemployment.
- Component analysis: The book details how net exports, final sales, and inflation-adjusted nominal GDP relate to overall economic health.
- Revisions matter: Initial GDP estimates are often revised, which can significantly alter the economic outlook.
What is the role and market impact of the Employment Situation Report in "The Secrets of Economic Indicators"?
- Dual survey approach: The report combines the household survey (unemployment rate) and the establishment survey (job creation and wages).
- Market-moving data: Released monthly, it often causes immediate reactions in stocks, bonds, and currency markets.
- Economic barometer: It reflects the health of the labor market, which drives consumer income and spending—key to U.S. economic output.
- Detailed breakdown: The report includes data on hours worked, wage growth, and sector-specific employment trends.
How does Bernard Baumohl describe the Consumer Price Index (CPI) and its importance?
- Definition and scope: CPI measures the average change in prices for a basket of over 200 goods and services, representing the cost of living for urban consumers.
- Calculation complexities: Adjustments are made for changes in product quality, packaging, and technological improvements, as well as for seasonal effects.
- Market sensitivity: CPI releases are highly influential, affecting bond prices, stock valuations, and the U.S. dollar.
- Inflation indicator: Unexpected increases in CPI can lead to higher interest rates and lower bond prices, while stable inflation supports growth.
What is the Index of Leading Economic Indicators (LEI) and how is it used in "The Secrets of Economic Indicators"?
- Composite forecasting tool: LEI combines 10 forward-looking indicators, such as unemployment claims, building permits, and the ISM manufacturing survey.
- Early warning system: It helps predict economic turning points before they appear in lagging indicators like unemployment.
- Mixed track record: While often successful in predicting recoveries, LEI can sometimes give false signals, so interpretation requires caution.
- Market influence: LEI affects investor sentiment, though its market impact is sometimes muted since underlying data is usually known.
How does Bernard Baumohl explain the business cycle and its relevance to economic indicators?
- Five phases: The business cycle includes peak, recession, trough, recovery, and expansion, reflecting natural economic fluctuations.
- Indicator sensitivity: Some indicators are more relevant at certain phases; for example, housing starts and stock indexes are leading indicators during recessions.
- Recession dating: The National Bureau of Economic Research uses multiple indicators, not just GDP, to officially date recessions.
- Strategic use: Understanding the cycle helps investors and business leaders anticipate shifts and adjust strategies accordingly.
What insights does "The Secrets of Economic Indicators" by Bernard Baumohl provide about international economic indicators?
- Global economic integration: The book stresses the importance of understanding foreign indicators from major economies like Germany, Japan, China, India, Brazil, and the Eurozone.
- Key foreign reports: Highlights include German Industrial Production, Japan’s Tankan Survey, Eurozone PMI, and China’s Industrial Production.
- Currency and trade impact: Foreign economic health influences currency values, trade balances, and U.S. financial markets.
- Data access challenges: The book offers guidance on finding reliable international data, noting issues like language and data quality.
What is the Yield Curve and why is it considered a powerful economic indicator in "The Secrets of Economic Indicators"?
- Definition and shape: The yield curve plots yields of U.S. Treasury securities across maturities, with normal, steep, flat, and inverted shapes indicating different economic conditions.
- Predictive power: An inverted yield curve has preceded all U.S. recessions since 1960, making it a highly reliable recession predictor.
- Market and policy implications: The curve reflects investor expectations about growth and inflation, influencing bond prices, stock markets, and monetary policy.
- Interpretation tips: Baumohl explains how to read the yield curve and use it alongside other indicators for a comprehensive outlook.
What are the best quotes from "The Secrets of Economic Indicators" by Bernard Baumohl and what do they mean?
- On market-moving data: “Economic statistics, employment data, Federal Reserve surveys... can drive markets into a frenzy, causing billions of dollars to be made or lost in an instant.” —Robert Hormats, highlighting the power of economic indicators.
- On accessibility: “Bernie Baumohl has successfully demystified the world of financial and economic news... Every businessperson or investor should keep a copy of Baumohl’s book close at hand.” —Hugh Johnson, emphasizing the book’s clarity and usefulness.
- On investing advantage: “If you want to make money investing, this is an essential trend-tracking tool that will help get you to the bank.” —Gerald Celente, underscoring the book’s practical value for investors.
- On global perspective: The book’s quotes and commentary reinforce the importance of understanding both U.S. and international economic trends for successful investing.
Review Summary
The Secrets of Economic Indicators receives mixed reviews. Many praise it as an excellent reference book for understanding economic data and indicators, particularly useful for investors and students. Readers appreciate its comprehensive coverage and clear explanations. However, some find it dry, boring, and difficult to read cover-to-cover. Critics note it's more of a primer or brochure than an in-depth analysis. The book is primarily U.S.-focused, which some international readers find limiting. Overall, it's considered a valuable resource for those interested in economics, despite its limitations.
Similar Books




Download PDF
Download EPUB
.epub digital book format is ideal for reading ebooks on phones, tablets, and e-readers.
