Key Takeaways
A decade of blown accounts preceded a 941% championship year
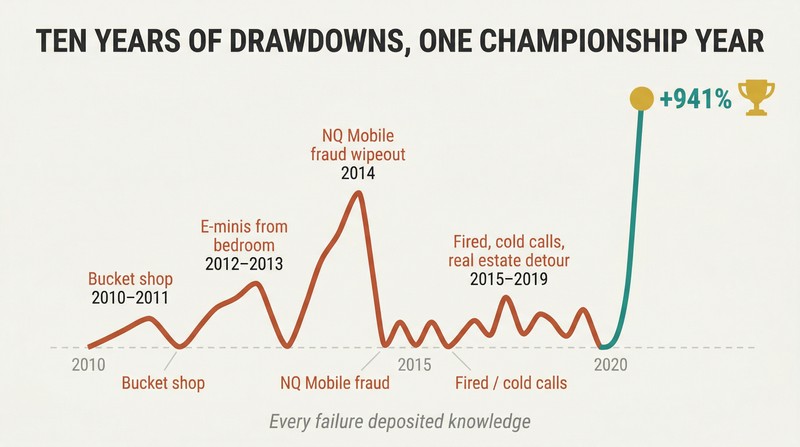
Oliver Kell's path was brutal. He graduated college in 2010 with $5,000, worked at a "modern day bucket shop" with 60:1 margin, and made nothing. He traded e-minis from his mother's bedroom. He ran a $7,500 options account to six figures in a stock called NQ Mobile — then Muddy Waters exposed it as a fraud, and his entire annual income evaporated in a single day. He was essentially fired from an institutional brokerage, failed as a financial advisor making 200 – 300 cold calls per day, and even detoured into Philadelphia real estate.
Every failure deposited knowledge. The bucket shop taught order flow. The institutional desk taught block trading and algorithmic execution. Being unable to trade compliance-restricted positions forced him through every human emotion — and taught him how price actually moves. In 2020, he entered the U.S. Investing Championship, posted a +941.1% return, and won.
Map every stock's position in the Cycle of Price Action
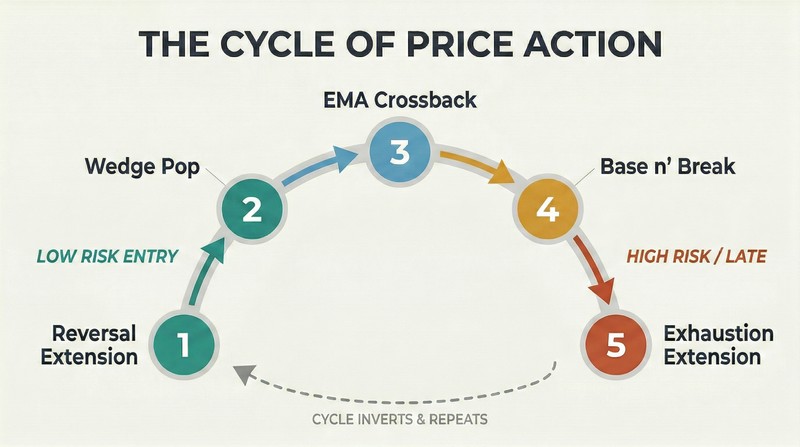
Kell's core framework is a repeating cycle that every stock moves through as it bottoms, trends, and tops. For an uptrend, the five phases are:
1. Reversal Extension — capitulation at a support level on heavy volume
2. Wedge Pop — price recaptures the 10/20 EMA for the first time
3. EMA Crossback — the first pullback to the moving averages after the pop
4. Base n' Break — a multi-day consolidation above the EMAs that breaks higher
5. Exhaustion Extension — price stretches far from the 10 EMA, signaling a potential top
The sequence then inverts for a downtrend. This framework isn't rigid — steps can be skipped — but it prevents buying late-stage moves and helps identify low-risk entries early in new trends. Kell applied this to TSLA, ZM, FSLY, and TWLO throughout 2020.
Ride the weekly trend, define your stop on the five-minute chart
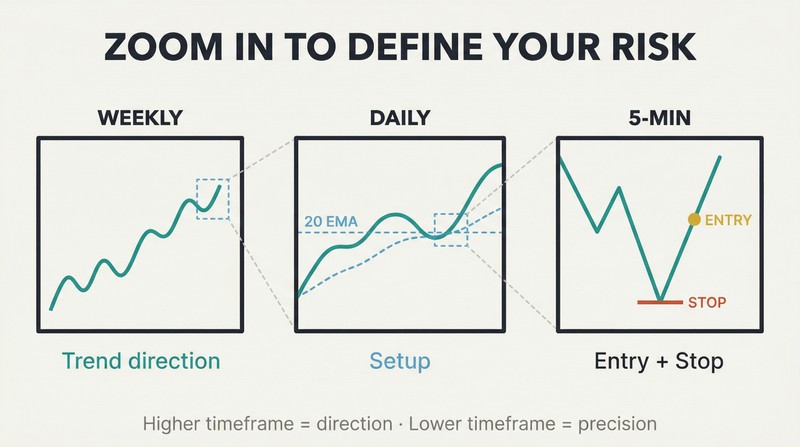
Price action is fractal. The same Cycle of Price Action patterns appear on five-minute charts, hourly charts, daily charts, weekly charts, and monthly charts. Kell exploits this by using higher timeframes to identify the direction of the trend and lower timeframes to pinpoint entries and manage risk. A stock pulling back to its Daily 20 EMA, for example, might show a Reversal Extension on the 5-minute chart — that intraday setup gives a tight stop while capturing the daily trend.
Kell uses five tools across all timeframes: price, volume, the 10 and 20 exponential moving averages, the 50 and 200 simple moving averages, and chart patterns. The weekly and monthly charts tell him whether a stock is early or late in its trend. The daily and intraday charts tell him where to buy and where to place his stop.
During crashes, hunt for stocks making higher lows
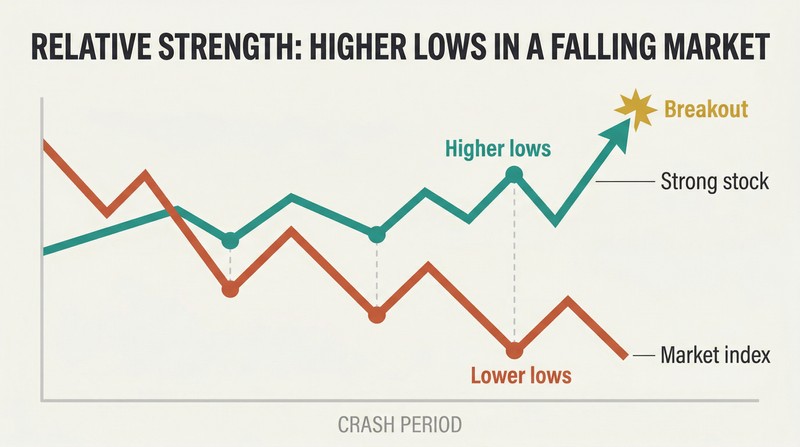
Relative strength is Kell's primary stock filter. When the NASDAQ made five consecutive lower lows during the March 2020 Covid crash, Livongo Health ($LVGO) started making higher lows on March 18. By March 23, LVGO had two higher lows versus two lower lows in the index — a positive divergence. When both put in a Wedge Pop, LVGO exploded into a leadership stock for the entire market.
Kell describes these stocks as "Stubborn to the Downside" or having "No Sellers Down Low." The principle is simple: stocks that refuse to fall with the market contain buyers who will overwhelm sellers the moment selling pressure eases. This is why Kell avoids shorting during corrections — it distracts from uncovering the next big winners hiding in relative strength.
Target breakouts from big bases with earnings catalysts
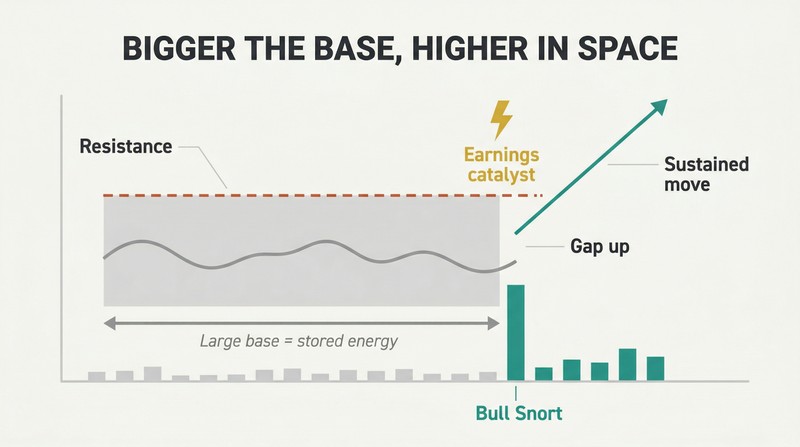
Bigger the base, higher in space. Kell identifies three traditional CAN SLIM base patterns — Cup with Handle, Double-Bottom Base, and Flat Base — plus non-traditional patterns like bull flags, bull pennants, and descending channels. Large monthly bases signify major shifts in sentiment, and when they break out on heavy volume with an earnings surprise, the move tends to be powerful and sustained.
Fastly ($FSLY) broke through $26 on earnings with massive volume out of a large weekly base. The unfilled gap confirmed strength. Spotify ($SPOT) and Twilio ($TWLO) both showed enormous monthly bases before launching extended uptrends. The volume on the breakout day matters — Kell calls heavy institutional volume signatures "Bull Snorts." Without that volume, the breakout lacks institutional sponsorship.
Count extensions from the 10 EMA — the second one means sell
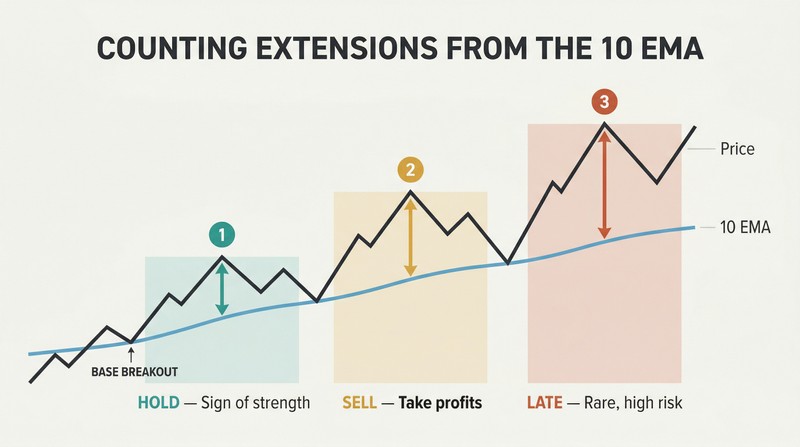
Extensions are your exit clock. After a base breakout, Kell counts how many times price extends away from the 10-day EMA. The first extension can usually be held through — it's a sign of strength. The second extension from the daily 10 EMA is the high-probability profit-taking zone, especially if price is also extended from the Weekly 10 EMA. A third extension is rare and means you're very late in the trend.
TSLA demonstrated this perfectly. After its Cup n' Handle breakout, the first extension was a gap up that could be held. The second extension led to a sustained basing period. Kell uses the same count on TWLO and ZM. When daily and weekly extensions coincide, he calls it "confluence" — and that's when profit-taking becomes urgent rather than optional.
Sell at multiples of your risk to become the casino
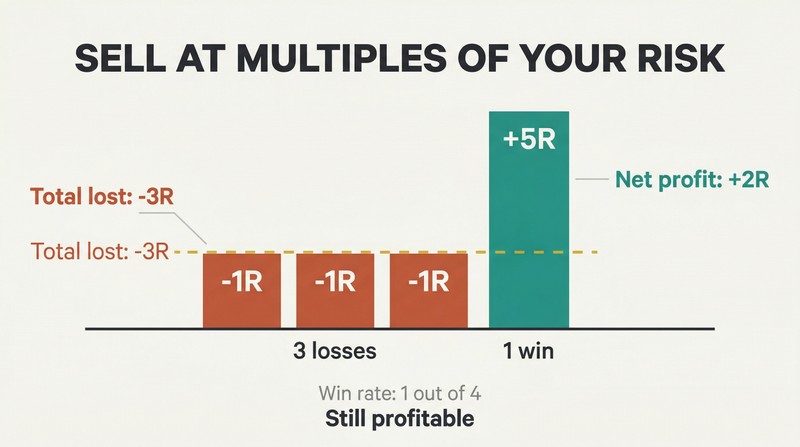
"Sell Some, Hold Some" is Kell's mantra. If you risked $2 per share and now have a $10 gain — 5x your risk — it's reasonable to take partial profits while holding a core position for a larger move. This asymmetry is the mathematical engine of the strategy: each win pays for multiple losses.
Stop placement creates the tight risk. Kell uses the breakout day low, ignition bar low, or the 10/20 EMA as trailing stops — whichever the stock is respecting. He also sells into gap-up exhaustion extensions when the stock is stretched from its moving averages. The combination of tight initial stops and selling into strength at multiples of risk means the strategy can tolerate a sub-50% win rate and still compound powerfully.
Double your position size while cutting your actual risk
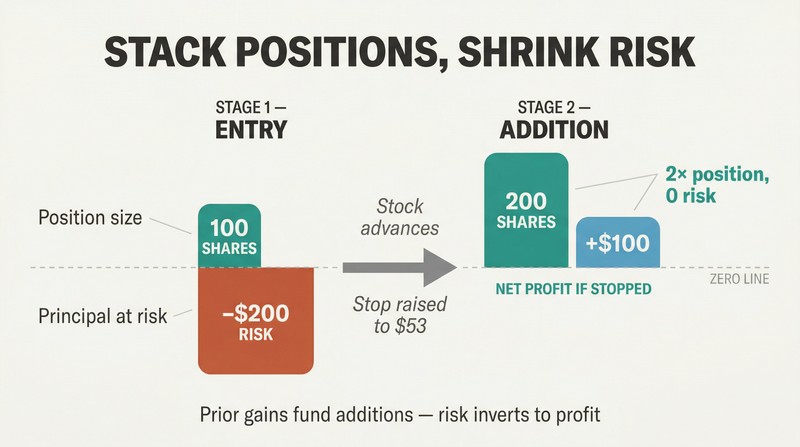
Buy in pieces, sell in pieces. Kell's core risk management technique uses initial profits to fund additions. Example: buy 100 shares at $50 with a $2 stop ($200 risk). Stock advances to $55, pulls back to $53, presents a new buy area at $55. Add 100 shares at $55, move the stop to $53 on the entire 200-share position. If stopped out, you still net $100 profit. You've doubled your position and profit potential while reducing principal at risk.
This stacking technique compounds through the trend. Each Base n' Break or EMA Crossback within an uptrend is an opportunity to add shares using prior gains as a cushion. Stops tighten as position size grows. The result: large positions in winning trades that can genuinely move the account, built on a foundation of house money rather than fresh risk.
When QQQ drops below the 20 EMA, shift to defense
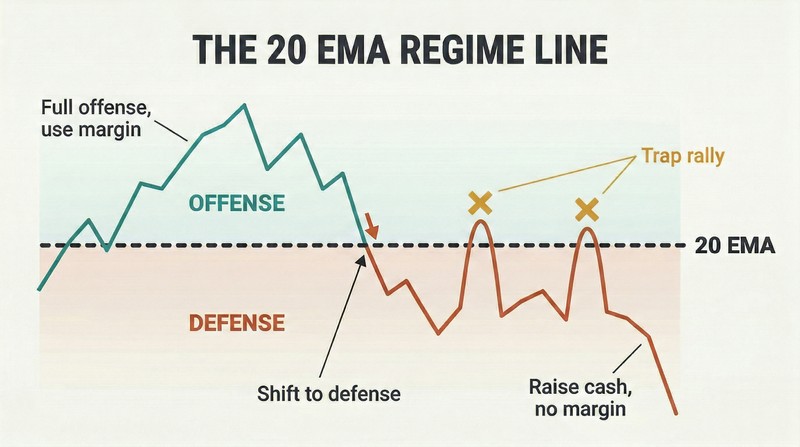
The QQQ is Kell's market regime filter. When the NASDAQ 100 ETF is trading below its 20-day exponential moving average, the environment is hostile for growth stock longs. Kell's response: raise cash, avoid margin, and become far more selective. A confirmed Wedge Drop below the 20 EMA — triggered by a Blowoff Extension like September 2020 — is the official signal to shift defensive.
Bear market rallies are traps. Kell notes that the biggest single-day rallies happen during corrections, creating false hope. He's been short at times expecting a market break, watched it rally 5% against him in the morning, gotten stopped out, then watched it roll over and finish red. Margin should only be deployed when progress is being made and the broader trend supports it.
Everyday consumer awareness spots growth winners Wall Street misses
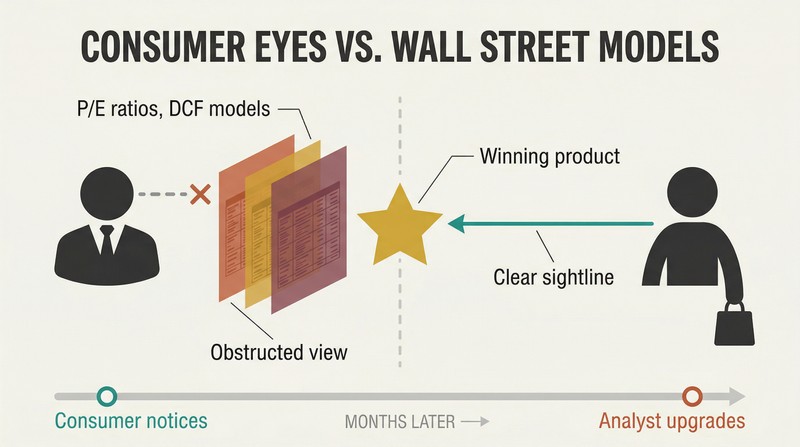
Wall Street's models fail on transformational companies. Top-performing growth stocks consistently surprise and exceed analyst estimates because mathematical models can't capture paradigm shifts. Kell argues the average person has a better feel for emerging brands than a professional CFA. His wife's ignorance of traditional valuation metrics is, paradoxically, an edge — she evaluates the product, not the P/E ratio.
The 2020 winners proved this. Zoom became a household verb. Peloton replaced gyms. Etsy and Shopify powered small-business e-commerce. These themes were obvious to consumers months before analysts upgraded. Kell combines this Peter Lynch "Buy What You Know" insight with his technical filters: if a stock has strong earnings growth, sales growth of 25%+ annually, relative strength, a powerful theme, AND you understand the business — that's a "Top Idea."
Your worst trading urges are contrarian signals in disguise
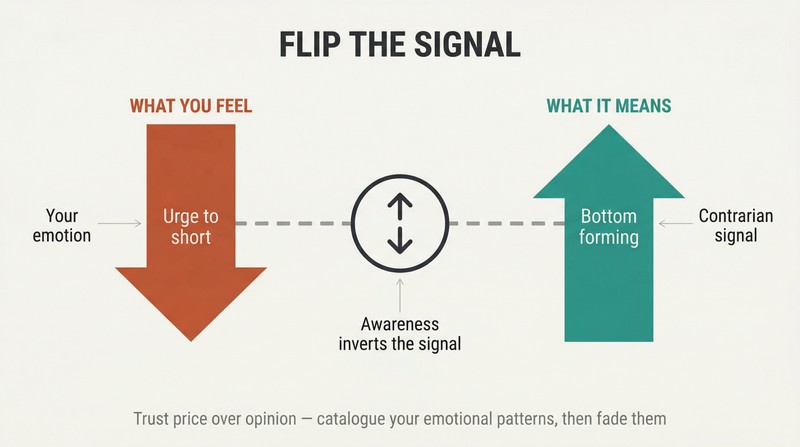
Kell uses his own emotions as indicators. He noticed a recurring pattern: near market bottoms, he feels a powerful urge to short stocks — even though he rarely shorts. Instead of acting on it, he treats the feeling as a signal that a Wedge Pop may be forming and a new uptrend could be imminent. The awareness doesn't eliminate the negative feeling, but it prevents him from acting on it at the worst time.
The reaction to news matters more than the news itself. An election, Fed meeting, or earnings report is merely a catalyst — price action determines how the event plays out. Depending on where a stock sits in its price cycle, good news gets sold and bad news gets bought. Kell advises traders to trust price over opinions, and to catalogue their own emotional patterns so they can fade them.
Analysis
Oliver Kell's book sits squarely in the CAN SLIM lineage — O'Neil to Minervini to Kell — but its genuine contribution is the Cycle of Price Action, a systematic framework that gives names and decision rules to phases most growth stock traders navigate by instinct alone. By labeling each phase (Reversal Extension through Exhaustion Extension) and mapping them across multiple timeframes, Kell converts a loose collection of chart-reading heuristics into something approaching a procedural algorithm. This is more useful than it sounds: most trading books tell you to 'buy breakouts' and 'cut losses short' without specifying where in a trend's lifecycle you're operating.
The book's primary limitation is that its championship year, 2020, was arguably the most favorable environment for momentum growth stock trading in a generation. The COVID crash created a clean Reversal Extension across the entire market, followed by an extended Fed-fueled uptrend in precisely the cloud, e-commerce, and telehealth names Kell's system is designed to capture. A 941% return in that environment, while extraordinary, doesn't demonstrate how the system performs during extended bear markets, sector rotations, or range-bound chop. Kell acknowledges this implicitly when discussing the difficulty of trading during corrections.
What elevates the book beyond technical pattern-matching is the memoir thread. Kell's candor about losing an entire year's income in NQ Mobile, being fired, and trading from his childhood bedroom creates genuine credibility. These aren't hypothetical drawdowns — they're the emotional scar tissue that makes his emphasis on stop losses and capital protection feel earned rather than theoretical. The tension he identifies between rules-based discipline and gut-feel intuition is one of trading's genuine philosophical puzzles, and his answer — use both, but always manage risk — is more honest than most prescriptions. The book is ultimately a practitioner's field manual rather than an academic study, and should be read as such.
People Also Read


Glossary
Cycle of Price Action
repeating trend phase frameworkKell's core framework describing the predictable sequence of phases a stock moves through as it transitions from downtrend to uptrend and back. For an uptrend: Reversal Extension → Wedge Pop → EMA Crossback → Base n' Break → Exhaustion Extension. The sequence inverts for downtrends. The cycle repeats across all timeframes, from five-minute to monthly charts.
Reversal Extension
capitulation bottoming signalThe first phase when a stock bottoms. Price becomes extended below the 10 EMA into a higher-timeframe support level. A reversal bar on heavy capitulation volume signals the potential for a trend change. Initial stops go below the reversal bar low, with the first profit target at the 20 EMA.
Wedge Pop
first recapture of moving averagesThe first time price trades back up through the 10/20 EMA after a Reversal Extension. Price trades in a tight range showing relative strength, the EMAs tighten, and when price recaptures them, it confirms the reversal and provides the first clean buy area. The buy signal triggers with a stop below the near-term consolidation.
EMA Crossback
first retest of moving averagesThe first pullback to the 10/20 EMA following a Wedge Pop. Price has already recaptured the moving averages, then pulls back into them for the first time. Traders buy against the EMAs with stops below. If the EMAs hold, a trend is forming; if they fail, the loss is small. Stops trail higher with the EMAs.
Base n' Break
consolidation breakout patternA multi-day or multi-week consolidation where price finds support at the 10/20 EMA. Buying occurs against the moving averages with confirmation adds on the breakout above the consolidation's highs. Stops are placed at a loss of the moving averages. This pattern can repeat multiple times during a sustained uptrend.
Exhaustion Extension
overextended topping signalWhen price extends significantly away from the 10 EMA, indicating potential topping or the need for a consolidation period. The first extension can often be held through. The second extension from the 10 EMA is generally the profit-taking zone. A third extension signals the trader is very late in the intermediate-term trend.
Wedge Drop
first break below moving averagesThe first time price drops back below the 10/20 EMA after an Exhaustion Extension. This confirms the exhaustion signal and officially ends the uptrend cycle. It is a sell signal for longs. In a downtrend context, it mirrors the Wedge Pop but in reverse, signaling continuation lower.
Bull Snorts
heavy institutional volume signaturesKell's term for unusually heavy volume in a stock relative to its typical trading volume. These spikes indicate institutional buying—large funds building positions. Retail traders should pay attention when Bull Snorts appear and look for low-risk entries, with the goal of riding institutional coattails for larger gains.
Reconfirming Price Strength Confirmation
new high validates prior pullbackBased on the Darvas Box concept. After a stock moves higher then pulls back or rests, it earns 'price strength confirmation' when it trades back through the highs that initiated the pullback. Stops are raised to below the new pivot low. In a winning stock, this repeats as the trend progresses and stops ratchet higher.
Too Tight For Too Long (TTFTL)
obvious trap tightening patternWhen a stock bases in a tight formation for an extended period, becoming obvious to all traders. If the underlying index is moving higher but the stock shows relative weakness while tightening, the setup can become a trap. When the expected breakout fails, the selloff tends to be violent because many traders are caught on the wrong side.
Download PDF
Download EPUB
.epub digital book format is ideal for reading ebooks on phones, tablets, and e-readers.


