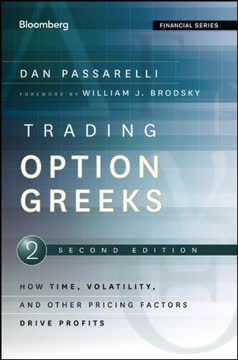
Key Takeaways
1. Options are Contracts, Greeks are Their DNA.
An option is a contract that gives its owner the right to buy or the right to sell a fixed quantity of an underlying security at a specific price within a certain time constraint.
Fundamental understanding. Options are not stocks; they are contracts granting rights (to buyers) and imposing obligations (on sellers) regarding an underlying asset. This distinction is crucial, as option holders do not possess ownership rights like voting or dividends, but rather the right to transact at a specific price (strike price) until a specific date (expiration). The price of an option, called its premium, comprises intrinsic value (in-the-money amount) and time value (premium over parity).
Standardized terms. Exchange-listed options have standardized terms, including contract size (usually 100 shares), expiration month (typically the Saturday following the third Friday), and strike price increments. Understanding these specifications is vital for any trader. The Options Clearing Corporation (OCC) guarantees every options trade, acting as an intermediary to ensure obligations are met, which is a cornerstone of market integrity.
Greeks quantify sensitivity. The "Greeks"—Delta, Gamma, Theta, Vega, and Rho—are derived from option-pricing models and measure an option's sensitivity to various market influences. These metrics are essential for understanding how an option's value changes with shifts in the underlying stock price, time, volatility, and interest rates. They transform option trading from mere directional bets into a multi-dimensional risk management discipline.
2. Delta: The Directional Compass of Options.
Delta is the option’s equivalent of a position in the underlying shares.
Measuring price sensitivity. Delta quantifies how much an option's price is expected to change for every one-dollar movement in the underlying asset. Calls have positive deltas (0 to 1.00), increasing in value as the stock rises, while puts have negative deltas (0 to -1.00), increasing as the stock falls. A 0.50 delta call, for instance, would theoretically gain $0.50 for a $1 stock increase.
Equivalent share exposure. Delta also represents the number of equivalent shares an option position controls. Buying ten 0.60-delta calls is akin to being long 600 shares of the underlying stock (10 contracts * 0.60 delta * 100 shares). This concept is fundamental for managing directional exposure and constructing delta-neutral positions.
Dynamic and probabilistic. Delta is not static; it changes with the stock price, time to expiration, and volatility. Furthermore, traders often use delta as a rough estimate of an option's probability of expiring in-the-money. For example, a 0.75 delta option is informally considered to have a 75% chance of finishing in-the-money.
3. Gamma & Theta: The Dynamic Duo of Time and Movement.
Gamma is the rate of change of an option’s delta given a change in the price of the underlying security.
Delta's accelerator. Gamma measures the rate at which an option's delta changes for every one-dollar move in the underlying stock. It's the "curvature" of an option's price sensitivity. Positive gamma benefits option buyers by increasing delta as the stock moves favorably and decreasing it as the stock moves unfavorably, effectively accelerating gains and decelerating losses. Conversely, negative gamma hurts option sellers.
Time's relentless erosion. Theta quantifies the rate at which an option's time value decays with each passing day. It's the "cost of time" for option buyers (negative theta) and the "profit from time" for option sellers (positive theta). At-the-money (ATM) options typically experience the fastest time decay, especially as expiration approaches, making theta a critical factor for short-term strategies.
The gamma-theta trade-off. These two Greeks are intrinsically linked: positions with higher absolute gamma tend to have higher absolute theta. Option buyers seek positive gamma to profit from movement, accepting negative theta as the cost. Option sellers embrace positive theta, hoping the underlying remains stable, while managing the risk of negative gamma if the stock moves unexpectedly. This dynamic relationship is central to many option strategies.
4. Vega: The Pulse of Implied Volatility.
Vega is the rate of change of an option’s theoretical value relative to a change in implied volatility.
Volatility's impact. Vega measures an option's sensitivity to changes in implied volatility (IV), which is the market's expectation of future price fluctuations. A positive vega means an option's value increases when IV rises and decreases when IV falls, benefiting option buyers. Conversely, negative vega benefits option sellers when IV declines.
Implied vs. historical volatility. Implied volatility (IV) is derived from an option's market price, reflecting collective market sentiment about future volatility. Historical volatility (HV) measures past price fluctuations. While related, they can diverge, especially around anticipated events like earnings reports, creating "rush and crush" scenarios where IV spikes before news and collapses afterward.
Strategic considerations. Vega is crucial for strategies where IV changes are a primary profit driver.
- Long Vega (buying options): Benefits from rising IV, often used when expecting increased uncertainty or market events.
- Short Vega (selling options): Benefits from falling IV, common in stable markets or after anticipated events.
ATM options generally have the highest vega, as they possess the most time value, which is directly impacted by IV changes.
5. Rho & Dividends: Subtle Influences on Option Value.
Rho is the rate of change in an option’s value relative to a change in the interest rate.
Interest rate sensitivity. Rho measures how an option's value changes with a one-percentage-point shift in interest rates. Calls have positive rho (value increases with rising rates), while puts have negative rho (value decreases with rising rates). This is because calls are a cheaper substitute for owning stock, and the capital saved can earn interest, while puts represent a cost that is offset by short stock rebates.
Time and strike impact. Rho's effect is more pronounced in long-term options (LEAPS) and options with higher strike prices, as the interest component is calculated on the strike price over time. While often negligible for short-term options, rho can be a significant factor for long-dated positions, especially in environments of volatile interest rates.
Dividends alter pricing. Dividends, though not a Greek, significantly impact option pricing, particularly for American-style options. Call holders do not receive dividends, making calls less attractive as ex-dividend dates approach, potentially leading to early exercise of in-the-money (ITM) calls. Conversely, put holders benefit from dividends as the stock price typically drops by the dividend amount on the ex-date, increasing put value. Traders must accurately input expected dividend dates and amounts into pricing models to avoid misvaluations and potential arbitrage opportunities.
6. Put-Call Parity: The Arbitrage Foundation of Option Pricing.
A long call is synthetically equal to a long stock position plus a long put on the same strike, once interest and dividends are figured in.
Fundamental relationship. Put-call parity is a core principle stating that a specific combination of a call, a put, and the underlying stock (adjusted for interest and dividends) should have equivalent value. This relationship ensures that no risk-free arbitrage opportunities exist between these instruments. It mathematically links the prices of calls and puts of the same strike and expiration.
Synthetic positions. This parity allows traders to create "synthetic" positions, where a combination of instruments mimics the risk/reward profile of another.
- Synthetic Long Call: Long Put + Long Stock
- Synthetic Long Put: Long Call + Short Stock
- Synthetic Long Stock: Long Call + Short Put
- Synthetic Short Stock: Short Call + Long Put
Understanding these equivalences is crucial for flexible strategy construction and identifying mispricings.
Arbitrage and efficiency. Market makers and arbitrageurs constantly monitor put-call parity. If the relationship deviates, they exploit the temporary mispricing by simultaneously buying the undervalued combination and selling the overvalued one, locking in a risk-free profit. This activity quickly brings prices back into line, ensuring market efficiency. For retail traders, synthetics offer alternative ways to achieve desired exposures, potentially at a better price or with different margin implications.
7. Vertical Spreads: Precision Risk Management for Directional Views.
Vertical spreads allow a trader to limit potential directional risk, limit theta and vega risk, free up margin, and generally manage capital more efficiently.
Defined risk and reward. Vertical spreads involve buying one option and selling another of the same type (both calls or both puts) and expiration, but with different strike prices. This structure defines both maximum profit and maximum loss, making them ideal for traders with specific directional forecasts and a desire for controlled risk.
Four core types:
- Bull Call Spread: Buy lower strike call, sell higher strike call (net debit, bullish).
- Bear Call Spread: Sell lower strike call, buy higher strike call (net credit, bearish/neutral).
- Bear Put Spread: Buy higher strike put, sell lower strike put (net debit, bearish).
- Bull Put Spread: Sell higher strike put, buy lower strike put (net credit, bullish/neutral).
These spreads offer a more nuanced approach than outright option purchases, balancing cost, risk, and profit potential.
Greek management. Vertical spreads significantly reduce exposure to gamma, theta, and vega compared to single-leg options. By combining a long and a short option, many of the sensitivities cancel each other out. This allows traders to focus primarily on directional movement (delta) while mitigating the impact of time decay and volatility fluctuations, making them efficient tools for targeted market views.
8. Wing & Calendar Spreads: Mastering Neutrality and Time.
These types of spreads have a lot of moving parts and can be intimidating to newcomers.
Neutrality and range-bound profits. Wing spreads, such as butterflies and condors (and their "iron" variants), are designed to profit from a stock remaining within a specific price range until expiration. They involve three or four strike prices, typically selling the "guts" (middle strikes) and buying the "wings" (outer strikes) to limit risk.
- Butterflies: Three strikes, maximum profit at the middle strike.
- Condors: Four strikes, maximum profit within a range between the two middle strikes.
These strategies are ideal for traders expecting low realized volatility and minimal directional movement.
Time and volatility term structure. Calendar spreads (or time/horizontal spreads) involve options with the same strike but different expiration dates. They profit from the faster time decay of the short-dated option relative to the long-dated one, especially if the underlying stays near the strike.
- Buying a calendar: Long back-month, short front-month (positive theta, positive vega).
- Selling a calendar: Short back-month, long front-month (negative theta, negative vega).
They also allow traders to speculate on the "term structure of volatility," buying options in months with relatively cheap implied volatility and selling in months with expensive implied volatility.
Complex but powerful. While seemingly complex due to multiple legs and strikes, these spreads offer sophisticated ways to manage risk and target specific market conditions. They allow traders to fine-tune their exposure to delta, gamma, theta, and vega, making them versatile tools for income generation or volatility speculation.
9. Delta-Neutral Trading: Isolating Volatility for Profit.
To be truly direction neutral or direction indifferent means to have a delta equal to zero.
Eliminating directional bias. Delta-neutral trading involves constructing a position where the net delta is zero, effectively removing immediate directional exposure to the underlying asset. This allows traders to focus purely on profiting from changes in volatility (both implied and realized) or time decay, rather than predicting market direction.
Trading implied volatility (IV). With delta neutralized, the primary profit driver becomes vega. Traders will buy delta-neutral positions (long vega) when they expect IV to rise, and sell delta-neutral positions (short vega) when they expect IV to fall. This often involves anticipating events like earnings reports, where IV might spike ("rush") and then collapse ("crush").
Beyond direction. Delta-neutral strategies are not about whether the stock goes up or down, but how much it moves (realized volatility) or how market expectations for movement change (implied volatility).
- Long volatility (long gamma/vega): Profits from large moves in either direction or rising IV.
- Short volatility (short gamma/vega): Profits from small moves or falling IV, often relying on theta decay.
This approach transforms trading into a game of statistical probabilities and risk management, rather than directional forecasting.
10. Gamma Scalping: Profiting from Realized Volatility Swings.
Positive gamma causes the delta-neutral trader to sell stock when the price rises and buy when the stock falls.
Capturing intraday swings. Gamma scalping is an active trading technique employed by delta-neutral traders with positive gamma. As the underlying stock price fluctuates, positive gamma causes the position's delta to become more positive when the stock rises and more negative when it falls. Traders then "scalp" these deltas by selling stock when the delta is positive (stock rises) and buying stock when the delta is negative (stock falls), locking in small profits from the stock's oscillations.
Theta as the cost. The goal of gamma scalping is to generate enough profit from these frequent stock trades to offset the daily cost of theta decay on the long option position. It's a race against time, where consistent, profitable scalping is necessary to cover the inherent cost of holding long options.
Art and science. Gamma scalping is not an exact science; it requires active management and a keen sense of market timing.
- Decision points: When to adjust deltas, how much stock to trade, and whether to "go home flat" (delta-neutral) at day's end.
- Risks: Over-hedging (buying high, selling low) can erode profits, and unexpected large moves can lead to significant losses if not managed effectively.
The success hinges on the underlying's realized volatility being sufficient to generate enough scalping opportunities to outpace theta.
11. Volatility Charts: Your Visual Guide to Market Expectations.
Volatility charts are invaluable tools for volatility traders (and all option traders for that matter) in many ways.
Visualizing volatility dynamics. Volatility charts plot both implied volatility (IV) and historical volatility (HV) over time, providing a comprehensive visual history of an asset's price movement and market expectations. These charts are essential for understanding whether options are currently "cheap" or "expensive" relative to past behavior and actual price swings.
Interpreting patterns. Analyzing the relationship between IV and HV reveals critical insights:
- IV > HV: Market expects higher future volatility than recent past.
- HV > IV: Stock has been more volatile than options imply for the future.
- Convergence/Divergence: Signals potential trading opportunities, like the "rush and crush" around earnings where IV spikes and then collapses.
Strategic decision-making. Volatility charts guide traders in:
- Identifying mean reversion: IV often returns to its historical average range.
- Timing trades: Buying volatility when IV is historically low, selling when it's high.
- Assessing risk: Understanding how much volatility the market is pricing in for specific events.
By studying these patterns, traders can make more informed decisions about when to buy or sell volatility, and which strategies are most appropriate.
12. Straddles & Strangles: The Purest Volatility Bets.
Straddles and strangles are the quintessential volatility strategies.
Betting on big moves (Long Straddle/Strangle). A long straddle involves buying an ATM call and an ATM put with the same strike and expiration. A long strangle involves buying an OTM call and an OTM put with different strikes but the same expiration. Both profit from a large move in the underlying asset, regardless of direction.
- Long Straddle: Higher cost, lower break-evens, benefits from movement near the strike.
- Long Strangle: Lower cost, wider break-evens, requires a larger move.
These strategies are pure bets on increased realized volatility and rising implied volatility (positive gamma and vega), but they incur significant theta decay.
Betting on stability (Short Straddle/Strangle). A short straddle involves selling an ATM call and an ATM put. A short strangle involves selling an OTM call and an OTM put. Both profit from the underlying remaining within a defined range and from declining implied volatility (negative gamma and vega, positive theta).
- Short Straddle: Higher premium, tighter break-evens, higher risk.
- Short Strangle: Lower premium, wider break-evens, lower risk (but still unlimited potential loss).
These are income-generating strategies that rely on time decay and low realized volatility, but they carry substantial risk if the stock makes a large, unexpected move.
Risk vs. reward. Straddles offer higher profit potential and tighter break-evens but come with higher cost and greater risk. Strangles offer a wider profit range and lower cost but with reduced maximum profit. Both are powerful tools for pure volatility speculation, demanding careful risk management and a clear outlook on future price movement and market expectations.
Last updated:
Review Summary
Trading Options Greeks receives high praise from readers, with an average rating of 4.29 out of 5. Reviewers appreciate its clear explanations of complex concepts, practical examples, and comprehensive coverage of option Greeks. Many find it excellent for beginners and intermediate traders, offering valuable insights into risk management and trading strategies. Some readers note its effectiveness in visualizing trades through Greeks. While a few mention it could benefit from more advanced topics, most agree it's a must-read for options traders seeking to enhance their understanding and skills.
Similar Books





Download PDF
Download EPUB
.epub digital book format is ideal for reading ebooks on phones, tablets, and e-readers.
