
Points clés
1. Trading is an art of strategic intelligence, not an exact science.
Le facteur déterminant du succès dans cette activité réside dans « l’intelligence stratégique ».
Strategic intelligence over credentials. Trading is not a purely academic pursuit where degrees, social status, or complex formulas guarantee success. Instead, it requires a unique form of strategic intelligence that allows an operator to view the markets differently from the crowd. A successful trader acts like a military general, anticipating moves several steps ahead and executing decisions with absolute precision.
An art of practice. Because the market is a complex, ever-changing environment, trading cannot be reduced to a rigid, exact science. There is no single, infallible formula or "Holy Grail" that works in all market conditions. Instead, traders must develop a personalized methodology that aligns with their psychological profile and the specific market environment they operate in.
Key trading styles. Depending on a trader's personality, capital, and time availability, they must specialize in one of the primary trading styles:
- Scalping: Ultra-short-term trading where positions are held for only a few minutes, aiming for small, rapid gains.
- Day Trading: Opening and closing all positions within a single session to avoid overnight risk.
- Swing Trading: Holding positions for several days to weeks to capture medium-term market swings.
2. Traditional fundamental analysis is insufficient for timing and predicting market moves.
Si l’analyse fondamentale est utile pour mesurer la « valeur » d’un actif financier, elle présente néanmoins de nombreuses limites et ne semble pas être une méthode appropriée pour anticiper les mouvements de marché, notamment les mouvements violents (krachs) et les bulles financières.
The limits of intrinsic value. Fundamental analysis assumes that asset prices always gravitate toward their "intrinsic" or "fundamental" value in the long run. However, in the short and medium term, prices can diverge drastically and durably from these theoretical values due to human emotions and speculative bubbles. Relying solely on balance sheets and economic indicators often leaves investors blind to sudden, violent market reversals.
Information asymmetry and bias. The ideal of perfect market transparency is a myth, as corporate insiders and institutional players frequently possess critical information long before the general public. Furthermore, financial analysts are human and highly susceptible to herd behavior, often adjusting their recommendations to match prevailing price trends rather than objective realities. This creates a dangerous lag where public recommendations are most bullish right at the market peak.
Why fundamentals fail in timing:
- Fundamental data is backward-looking and fails to capture real-time shifts in market psychology.
- Speculative bubbles can keep assets overvalued far longer than an investor can remain solvent.
- Markets often react counter-intuitively to fundamental news, rising on bad news or falling on good news.
3. Behavioral finance reveals that psychological biases systematically distort market rationality.
Les biais psychologiques détournent les individus de la « rationalité » mise en avant par l’approche néo-classique.
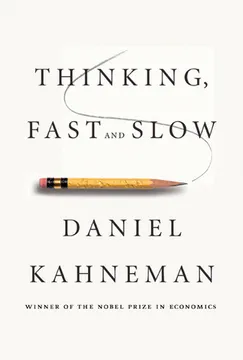
The myth of the rational investor. Traditional economic theories rely on the assumption of the "rational investor" who processes all information perfectly. Behavioral finance, pioneered by Nobel laureate Daniel Kahneman, completely dismantles this assumption by proving that human decision-making under uncertainty is systematically flawed. Traders are constantly influenced by cognitive and emotional biases that lead to irrational market behavior.
Prospect theory and loss aversion. One of the most powerful discoveries of behavioral finance is that humans experience the pain of a loss twice as intensely as the pleasure of an equivalent gain. This asymmetry explains why traders exhibit a strong aversion to risk when in a winning position, but become highly risk-seeking when facing a loss. They hold onto losing trades hoping to break even, while cutting winning trades prematurely to lock in a certain gain.
Key psychological biases in trading:
- Anchoring Bias: Relying too heavily on arbitrary reference points, such as the purchase price of a stock.
- Cognitive Dissonance: Ignoring information that contradicts one's established beliefs or market positions.
- Overconfidence: Attributing successful trades to personal genius while blaming losses on bad luck.
- Herd Behavior: Following the crowd blindly, which directly fuels speculative bubbles and panics.
4. Markets are driven by shared conventions and self-fulfilling prophecies rather than intrinsic values.
L’analyse technique est efficace dans la mesure où un assez grand nombre d’opérateurs y croient et l’utilisent.
The power of conventions. When objective fundamental values are impossible to determine, market participants rely on shared "conventions" to make decisions. A convention is a collective belief or rule of thumb that everyone conforms to because they expect everyone else to do the same. In the financial markets, these conventions dictate which economic indicators or technical levels are deemed important at any given time.
Self-fulfilling prophecies. Technical analysis owes much of its efficacy to the fact that it is a widely shared convention. When thousands of traders look at the same support levels, moving averages, or chart patterns, they place their orders at the same price points. This collective action directly causes the market to react at those levels, validating the technical signal through a self-fulfilling loop.
Key aspects of market conventions:
- Conventions are temporary and shift over time (e.g., focusing on trade deficits in one era and inflation in another).
- Speculative bubbles are rational under the convention model, as buying an overvalued asset is logical if you expect others to buy it even higher.
- The market behaves like Keynes' "beauty contest," where the goal is to predict what the average opinion expects, not to find objective beauty.
5. Technical analysis is a scientifically valid tool for mapping crowd psychology.
L’analyse technique se concentre sur ce qui est, plutôt que sur ce qui devrait être.
Focusing on reality. Unlike fundamental analysis, which tries to determine what an asset should be worth, technical analysis focuses strictly on what the asset is actually trading for. It operates on the premise that all known information, hopes, fears, and expectations are already discounted and reflected in the price. By studying price action, technical analysts bypass the noise of conflicting economic theories and focus on the ultimate reality of supply and demand.
Mapping human nature. The core of technical analysis is the study of human behavior, which remains remarkably consistent across centuries. Because fear, greed, hope, and panic are hardwired into the human psyche, price charts display recurring patterns that reflect these emotional cycles. Technical analysis is essentially the study of crowd psychology, providing a visual map of the ongoing battle between buyers and sellers.
Core tenets of technical analysis:
- Price action discounts everything, including fundamentals, political events, and psychological shifts.
- Prices move in trends, and a trend is highly likely to continue rather than reverse.
- History repeats itself because human nature and emotional reactions to financial risk are constant.
6. Trend following and chart patterns are powerful indicators of market momentum and reversals.
Un bon trader est un véritable stratège qui sait observer les marchés différemment des autres.
The trend is your ally. Identifying and following the dominant market trend is the most reliable way to achieve consistent trading profits. A trend is established when the market makes a succession of higher highs and higher lows (uptrend) or lower highs and lower lows (downtrend). Traders must align their positions with this momentum, buying during uptrends and selling during downtrends, rather than trying to pick tops and bottoms.
Chart patterns as psychological maps. Chart patterns, such as double tops, double bottoms, and head-and-shoulders, are not magical shapes; they are visual representations of shifts in the balance of power between buyers and sellers. For example, a double top shows that buyers tried twice to push the price higher but failed, signaling that the uptrend is exhausted and a reversal is imminent.
Key trend and chart concepts:
- Support and Resistance: Price levels where buying or selling pressure historically becomes strong enough to halt a price move.
- Trendlines and Channels: Diagonal lines that connect price extremes, helping traders identify the boundaries of a trend.
- Reversal Patterns: Formations like the head-and-shoulders that signal a major change in the market's direction.
- Continuation Patterns: Formations like flags and triangles that indicate the market is temporarily consolidating before resuming its trend.
7. Japanese candlesticks provide a real-time visual map of the battle between buyers and sellers.
Les bougies japonaises permettent de mieux cerner la psychologie des opérateurs et le combat acheteurs/vendeurs.
Visualizing market sentiment. Developed by Japanese rice traders in the 17th century, candlestick charts offer a far more expressive and intuitive view of price action than Western bar charts. Each candlestick tells a story of a specific trading session, showing the opening, high, low, and closing prices. The relationship between the body (the range between open and close) and the shadows (the extremes) instantly reveals who won the battle for that period.
Identifying turning points. Candlestick patterns are highly effective at identifying short-term market turning points and exhaustion. Patterns like the "doji" (where the open and close are identical) signal absolute indecision, while the "hammer" (a small body with a long lower shadow) shows that sellers pushed prices down but buyers fought back to close near the highs. These patterns act as early warning signals, alerting traders to potential trend reversals before they show up in other indicators.
Essential candlestick patterns for traders:
- Doji: Signals market indecision and potential exhaustion of the current trend.
- Hammer and Hanging Man: Single-candle patterns showing strong rejection of lower or higher prices.
- Engulfing Patterns (Avalements): Two-candle patterns where the second body completely swallows the first, signaling a powerful shift in momentum.
- Morning and Evening Stars: Three-candle reversal patterns that mark major market bottoms and tops.
8. Indicators like RSI, Stochastics, and MACD must be combined to filter out false signals.
Un indicateur technique, qui n’est pas validé par les bougies japonaises, pourra être éliminé.
The role of mathematical indicators. Technical indicators, such as the Relative Strength Index (RSI), Stochastics, and the Moving Average Convergence Divergence (MACD), are mathematical calculations based on price and volume. They are designed to measure the velocity and momentum of price movements, helping traders identify overbought or oversold conditions. However, no single indicator is perfect, and relying on one alone often leads to costly false signals.
The power of divergences. One of the most reliable signals in technical analysis is a divergence, which occurs when the price makes a new extreme but the indicator fails to do so. For example, a bearish divergence occurs when the price makes a higher high, but the RSI makes a lower high, signaling that the upward momentum is weakening. This mismatch often precedes a major market reversal, providing traders with an early exit or entry signal.
How to combine indicators effectively:
- Use trend-following indicators (like MACD or Moving Averages) to determine the overall market direction.
- Use oscillators (like RSI or Stochastics) to identify short-term overbought or oversold entry points within that trend.
- Confirm indicator signals with candlestick patterns and key support/resistance levels to filter out noise.
- Avoid over-complicating charts; a few well-chosen, non-redundant indicators are far more effective than a cluttered screen.
9. Money management and the risk of ruin are the ultimate determinants of a trader's survival.
La survie et la prospérité en trading dépendent énormément des techniques de money management...
Survival is the first priority. The single most common reason for trader failure is not a poor analysis method, but a complete lack of money management. A trader can have a highly accurate system, but without strict risk controls, a single bad trade or a normal string of losses can completely wipe out their capital. The primary goal of any trading strategy must be survival—preserving capital so that you can stay in the game long enough to let the probabilities work in your favor.
The mathematics of recovery. Money management is a game of numbers, and understanding the mathematics of losses is crucial. When a trader loses capital, the percentage gain required to recover that loss increases exponentially. For example, a 10% loss requires an 11% gain to break even, but a 50% loss requires a massive 100% gain just to return to the starting point. This mathematical reality is why limiting losses is far more important than maximizing gains.
Core money management rules:
- The 1% Rule: Never risk more than 1% to 2% of your total trading capital on a single trade.
- Risk/Reward Ratio: Only enter trades where the potential profit is at least two to three times the potential loss.
- Stop-Loss Orders: Always place a predetermined stop-loss order to exit a trade automatically if the market moves against you.
- Position Sizing: Calculate the number of shares or contracts to trade based on the distance to your stop-loss, not on a whim.
10. Successful trading requires absolute discipline, emotional control, and the elimination of ego.
Parmi les qualités les plus importantes en trading figurent l’ouverture d’esprit et l’absence d’ego.
The battle against yourself. The ultimate enemy of a trader is not the market, the market makers, or the algorithms, but their own psychology. Fear, greed, hope, and regret are the natural emotional reactions to financial risk, but they are completely destructive to trading performance. To succeed, a trader must develop absolute discipline, executing their plan with mechanical precision and completely separating their self-worth from the outcome of any individual trade.
Eliminating the ego. Having an ego is a fatal flaw in trading. An ego-driven trader wants to prove they are right, which leads to fighting the market, refusing to accept losses, and averaging down on losing positions. A professional trader, however, has no interest in being "right"; they only care about managing risk and making money. They accept losses quickly as a normal cost of doing business and move on without regret.
Psychological keys to trading success:
- Accepting Uncertainty: Embracing the fact that any individual trade has a random outcome, and focusing on the long-term edge.
- Discipline: Following your trading plan and risk rules consistently, especially during a losing streak.
- Humility: Submitting to the market's verdict and never trying to force your will or opinions on price action.
- Process Focus: Focusing on executing trades correctly according to your rules, rather than focusing on the money.